A lot of research has been (and is still) devoted to the development of mathematical techniques that can analyse (post-process) the experimental data collected during the tests of a nonlinear system in order to understand the nonlinear phenomena present in the response, estimate system parameters, or even identify a complete nonlinear dynamic model of the system.
In this area, my research aims to change the way tests are performed in order to generate much more useful (more informative) data that can in turn be exploited for system identification, model validation, etc. In particular, I work on the development of a method called control-based continuation (CBC), that does not require any sophisticated mathematical analysis a posteriori. Without the need for a mathematical model, CBC is a way of applying the concepts behind numerical continuation to a physical system. CBC combines stabilizing feedback control and path-following techniques in order to directly isolate the nonlinear behaviours of interest during experimental tests and track their evolution as parameters are varied. This allows the detection of boundaries between qualitatively different types of behaviours in a robust and systematic way as the experiment is running.
Measuring Nonlinear Normal Modes (NNMs)

NNMs describe the evolution of a system’s resonance frequencies for increasing vibration amplitudes. The NNMs of a system can be recovered experimentally if the applied excitation and the response of the system are in phase quadrature, i.e. 90 deg. apart.
CBC was adapted to track this phase quadrature condition for increasing oscillation amplitudes, tracing out a family of NNMs directly during the experimental tests. The method was validated on a series of experiments, including a nonlinear tuned-mass damper and a nonlinear energy harvester.
Besides the insight NNMs give on the dynamics of a nonlinear system, they also represent a great deal of useful information which can eventually be exploited for parametric nonlinear system identification, model updating and model validation.
Future challenges: I am now working to extend this method to systems with multiple degrees of freedom and which require multiple excitation points.
References: L. Renson et al. Robust Identification of Backbone Curves using Control-based Continuation. JSV 367 (2016) 145–158. / L. Renson et al. Experimental analysis of a softening-hardening nonlinear oscillator using control-based continuation. Proceedings of the IMAC XXXIV, 2016. / L. Renson et al. Experimental Tracking of Limit-point Bifurcations and Backbone Curves using Control-based Continuation. IJBC 2017.
Tracking Bifurcations
Bifurcations represent stability boundaries where dramatic qualitative and quantitative changes in the dynamics of a system can occur and, as such, they are often key to the understanding of a system’s dynamics.
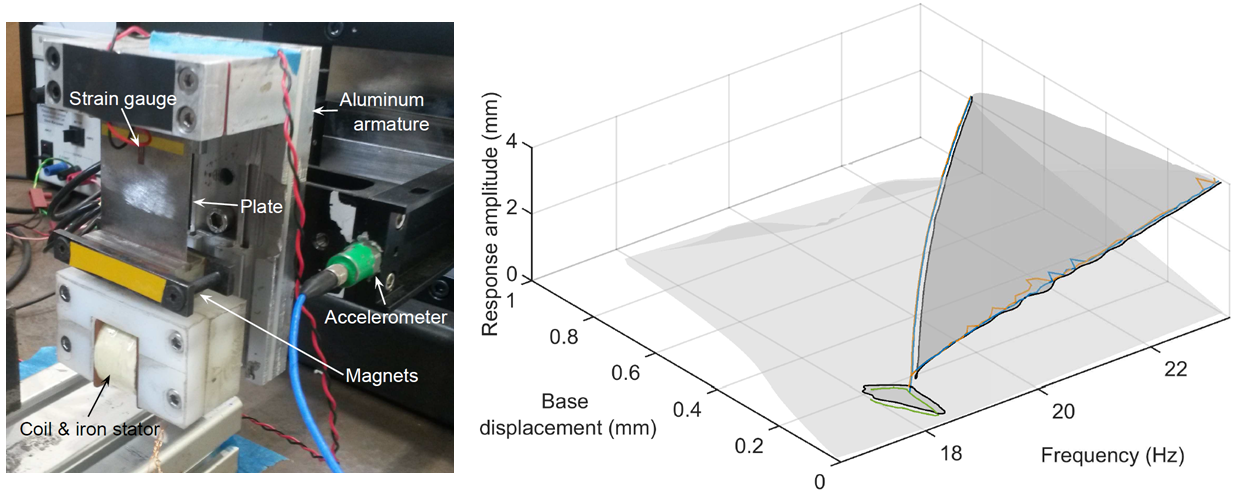
For instance, limit-point (LP) bifurcation curves can be used to predict the existence of isolated periodic solutions in the nonlinear frequency response of a system. LP bifurcations also represent stability boundaries and mark out the region where hysteretic behaviour can be observed when sweeping back and forth the resonance of nonlinear mechanical systems.
CBC was extended to detect and track LP bifurcations. The method, which relies on the geometric nature of these bifurcations, was successfully demonstrated on a nonlinear energy harvester.
Similarly to NNMs, bifurcation curves can be exploited for parametric nonlinear system identification, model updating and model validation.